
At Korean Re, our Asset Management Team is committed to driving stable investment income over the long term in a way that supports the company’s financial strength. Throughout 2020, we held steadfast to our prudent investment strategies in response to pandemic-induced shocks to the economy and heightened economic uncertainty. As a result, we demonstrated our ability to consistently deliver stable investment performance, achieving a return of 3.8% in the face of volatile economic and financial market conditions.
In 2020, the Korean economy slid into a recession as COVID-19 took its toll on economic output. Its GDP growth rate declined to 1%, representing the worst economic performance since the Asian financial crisis in 1998. Private consumption and employment tumbled as the coronavirus infection spread. Exports suffered a slump, although a recovery in outbound shipments managed to shore up the economy to some extent toward the end of the year.
For its part, the Bank of Korea cut its policy interest rate to a record low of 0.5%, following on the heels of rate cuts by the U.S. Federal Reserve and many other central banks in major economies. The yield on ten-year Korea treasury bonds hit a yearly low of 1.281% in July 2020, but it recovered to pre-pandemic levels in the final months of the year. The local stock market went through extreme swings from the beginning of the COVID-19 outbreak, but the Korea Composite Stock Price Index (KOSPI) closed the year at 2,873.47 up 30.5% from a year earlier on expectations of a rebound from the pandemic.
Against this challenging backdrop, our invested assets generated KRW 236.7 billion in investment income excluding foreign exchange gains/losses in 2020. We delivered a stable return on investments albeit down marginally from the previous year. As we continued to deploy capital into high-quality corporate bonds and government bonds, 39.6% of our investment income came from our foreign bond holdings, which amounted to KRW 93.7 billion. Income from alternative investments and domestic bond holdings accounted for 25.5% (or KRW 60.4 billion) and 29.7% (or KRW 70.4 billion), respectively.
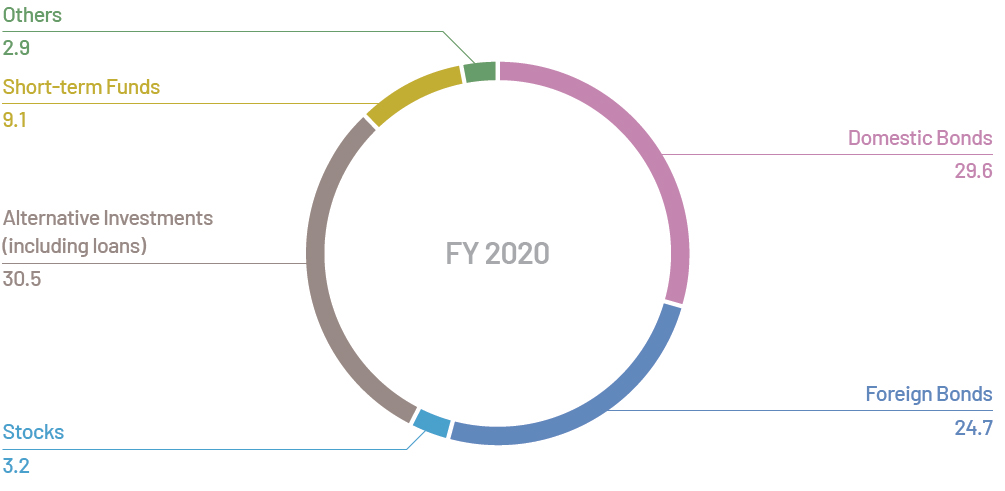
Similar to 2019, our investment operation has been geared toward ensuring the stability of our investment portfolio and maximizing the profitability of our invested assets throughout 2020. We reported a 3.2% growth in invested assets to KRW 6,417.6 billion as of the end of 2020, backed by stable inflows of investment and premium income. Compared to the previous year, there was little change in asset allocation in 2020. Our investment portfolio was dominated primarily by domestic fixed-income securities that were composed of government bonds and other high-quality corporate bonds, all of which accounted for 29.6% of the total invested assets. As we have been continuously compelled to search for new investment opportunities in the current low-yield environment, the proportion of alternative investments including loans stood at 30.5% of our total invested assets. Most of our alternative investment vehicles are loans – real estate loans and acquisition finance – and loan-linked products.
Looking forward to 2021, economic conditions are expected to improve somewhat, while the benchmark interest rate is likely to be maintained at the current level throughout the year, with one rate hike expected in 2022. As long as the low-yield environment is here to stay, we may have to continue our expansion into new and diversifying sources of investment return. Equally important is that we should stick to investment strategies that best fit our needs, such as achieving stable investment results and enhancing our financial strength to enable our business growth.
Investment Results 1)
(Units: KRW billion, USD million)
| FY 2020 (KRW) | FY 2020 (USD) | FY 2019 (KRW) | FY 2019 (USD) | |
| Invested Assets | 6,417.6 | 5,841.6 | 6,220.7 | 5,320.9 |
| Investment Income | 200.4 | 168.2 | 275.6 | 234.3 |
| Investment Income* | 236.7 | 198.6 | 235.8 | 200.4 |
| Yield (%) | 3.2 | 3.2 | 4.7 | 4.7 |
| Yield* (%) | 3.8 | 3.8 | 4.0 | 4.0 |
* Gains and/or losses from foreign exchange hedging for insurance liabilities have been excluded.
Invested Assets
(Units: KRW billion, USD million)
| FY 2020 (KRW) | FY 2020 (USD) | FY 2019 (KRW) | FY 2019 (USD) | |
| Domestic Bonds | 1,896.9 | 1,726.7 | 1,929.4 | 1,650.3 |
| Foreign Bonds | 1,585.8 | 1,443.5 | 1,507.0 | 1,289.0 |
| Stocks | 205.8 | 187.3 | 147.4 | 126.1 |
| Alternative Investments(including loans) | 1,955.7 | 1,780.2 | 1,650.4 | 1,411.7 |
| Short-term Funds | 587.5 | 534.8 | 800.1 | 684.4 |
| Others | 185.9 | 169.2 | 186.4 | 159.4 |
| Total | 6,417.6 | 5,841.6 | 6,220.7 | 5,320.9 |
✽ Individual figures may not add up to the total shown due to rounding.
Investment Income
(Units: KRW billion, USD million)
| FY 2020 (KRW) | FY 2020 (USD) | FY 2019 (KRW) | FY 2019 (USD) | |
| Domestic Bonds | 70.4 | 59.1 | 51.0 | 43.4 |
| Foreign Bonds | 57.4 | 48.2 | 118.0 | 100.3 |
| Foreign Bonds* | 93.7 | 78.6 | 78.2 | 66.5 |
| Stocks | 5.0 | 4.2 | 29.2 | 24.8 |
| Alternative Investments(including loans) | 60.4 | 50.7 | 70.1 | 59.6 |
| Short-term Funds | 9.4 | 7.9 | 8.8 | 7.5 |
| Others | -2.2 | -1.9 | -1.5 | -1.3 |
| Total | 200.4 | 168.2 | 275.6 | 234.3 |
| Total* | 236.7 | 198.6 | 235.8 | 200.4 |
* Gains and/or losses from foreign exchange hedging for insurance liabilities have been excluded.
✽ Individual figures may not add up to the total shown due to rounding.
Investment Portfolio Mix
(Units: KRW billion, USD million)
1) Investment results in this investment section are based on the Separate Financial Statements of Korean Re, reflecting investment operation at the head office only.